-
Commissions & Fees
-
Investment Offerings
-
Trading Platforms
-
Customer Service
-
Education and Research
-
Trustworthiness
For successful investing and trading, access to reliable and comprehensive tools remains essential.
TradingView and StockCharts represent two of the most popular platforms in this space, serving millions of users globally.
While both services deliver comparable charting and analysis capabilities for advanced traders, they each offer distinct advantages that set them apart.
This comprehensive comparison examines TradingView versus StockCharts across key areas including features, pricing, usability, and more to help you determine which platform best aligns with your trading needs.
Let’s begin with a detailed side-by-side comparison:
Comparison Table
| Feature | TradingView | StockCharts |
| Advanced Charting Tools | Yes | Yes |
| Technical Indicators | 100+ | 150+ |
| Custom Indicators | Yes | Yes |
| Social Network | Yes | No |
| Educational Resources | Minimal | Extensive |
| Key Offerings | Advanced & user-friendly charting tools, market news, watchlists, calendars, custom scanners, alerts, mobile app | Advanced charting tools, market summaries, watchlists, calendars, custom scanners, alerts, option quotes, StockChartsTV, mobile app |
| Pricing | Some free features and tools, Subscription plans starting at $12.95/mo, 1-month free trial | Many free features and services, Subscription plans starting at $14.95/mo, 1-month free trial |
| Mobile App | Yes + Desktop app option | Yes |
About the Services
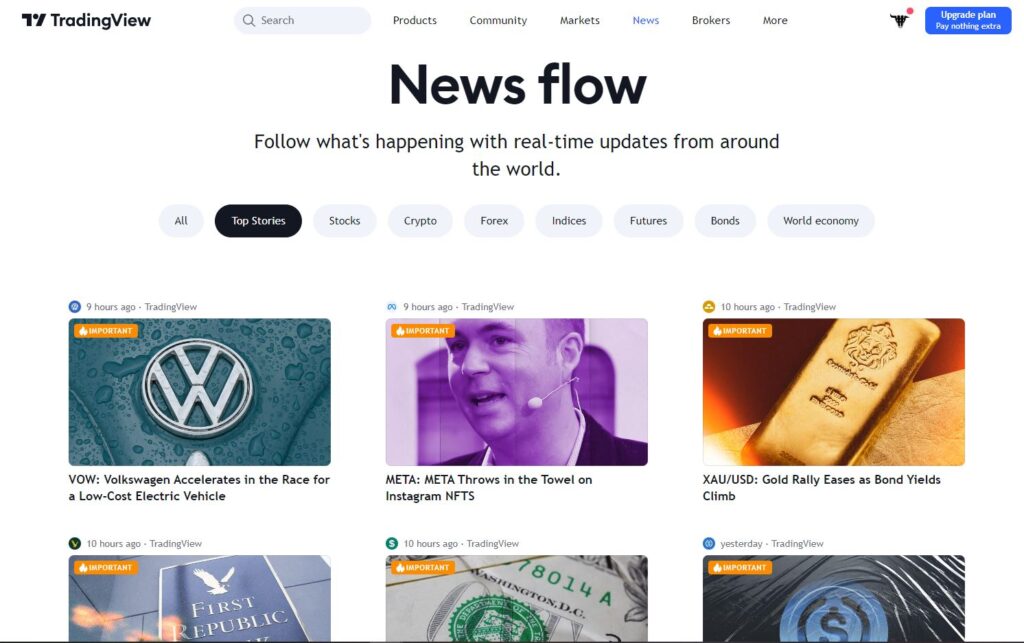
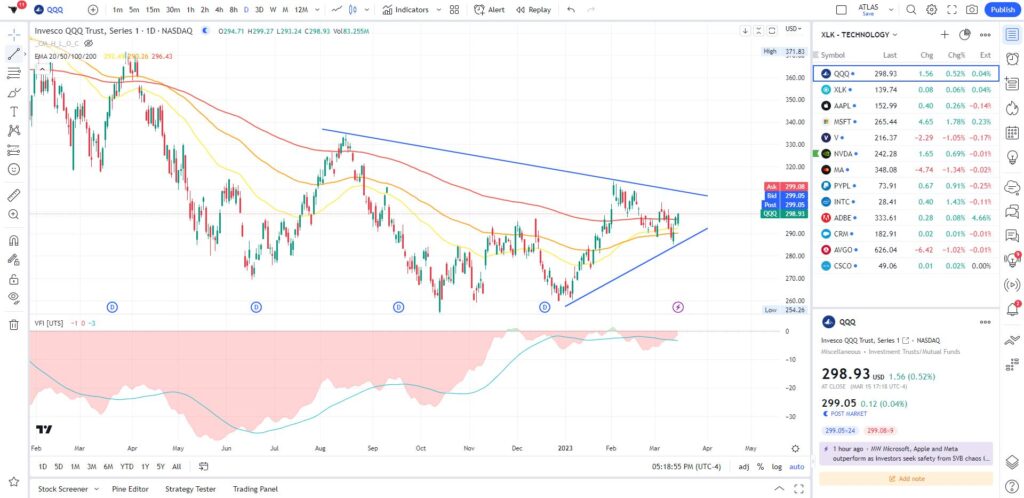
TradingView operates as a cloud-based charting and social networking platform, delivering real-time data across stocks, futures, forex, and cryptocurrency markets.

The platform delivers sophisticated charting tools, customizable indicators, and collaborative features through an elegant, user-friendly interface that enables traders to share and discuss ideas within an active community.
TradingView provides both free and paid tiers, with monthly subscriptions beginning at $12.95 per month.
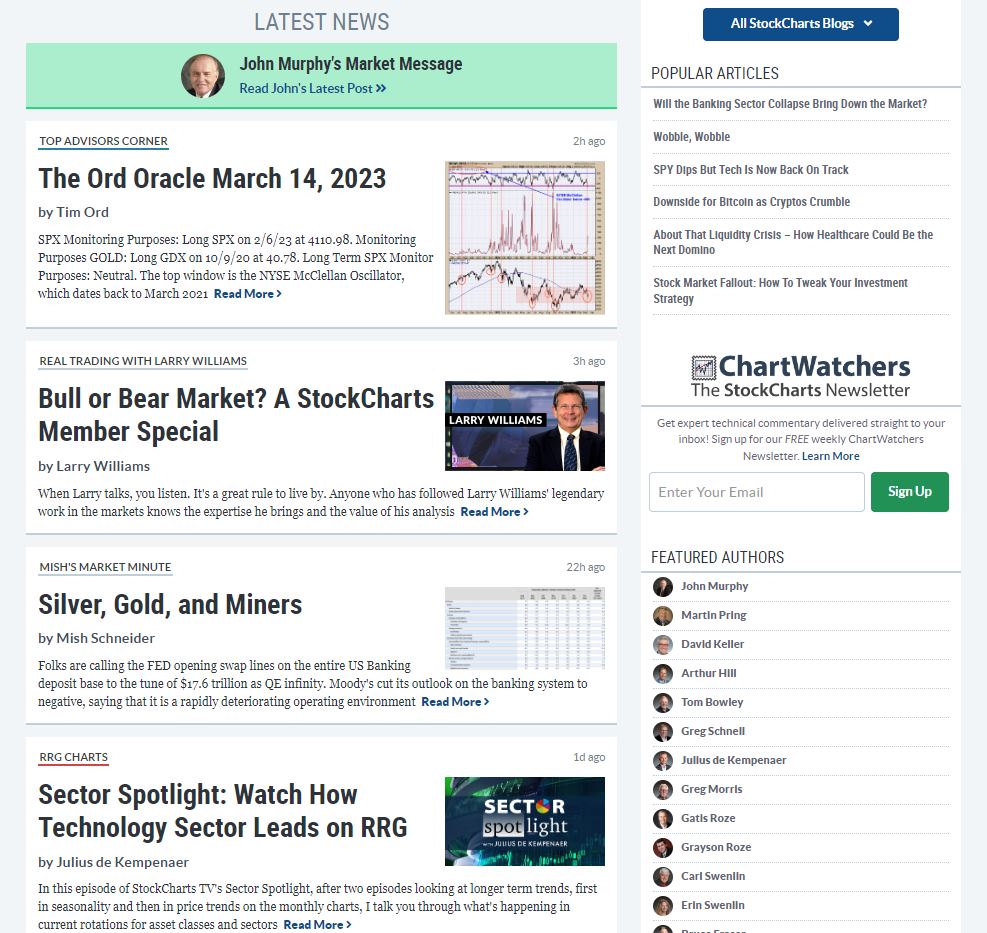
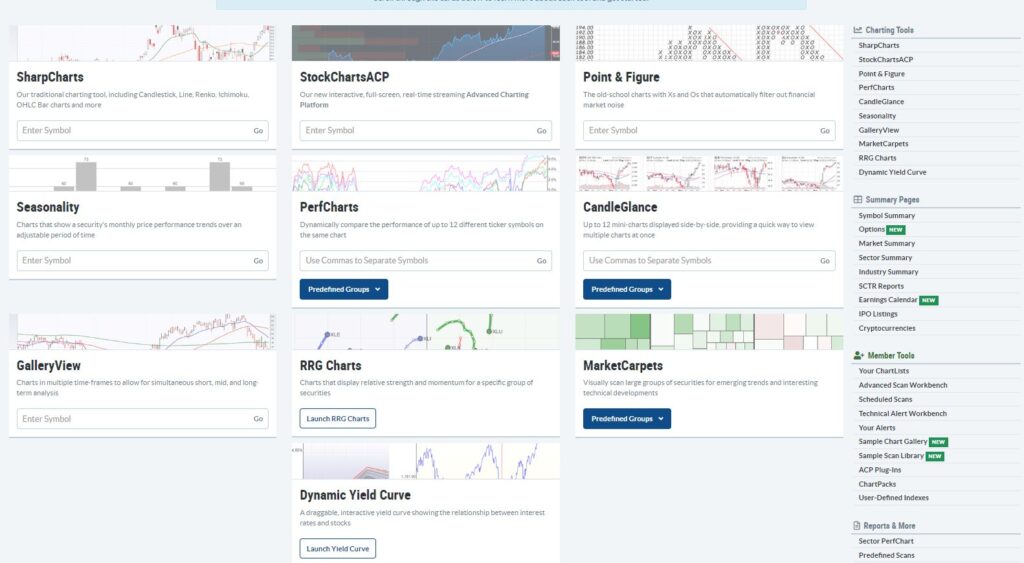
StockCharts serves as a comprehensive web-based financial charting and technical analysis platform, offering users extensive resources including market summaries, expert commentary, and thorough educational materials.
Similar to TradingView, it provides advanced charting capabilities, technical analysis tools, and customizable indicators, with subscription plans starting at $14.95 per month.
Comparison
Similarities:
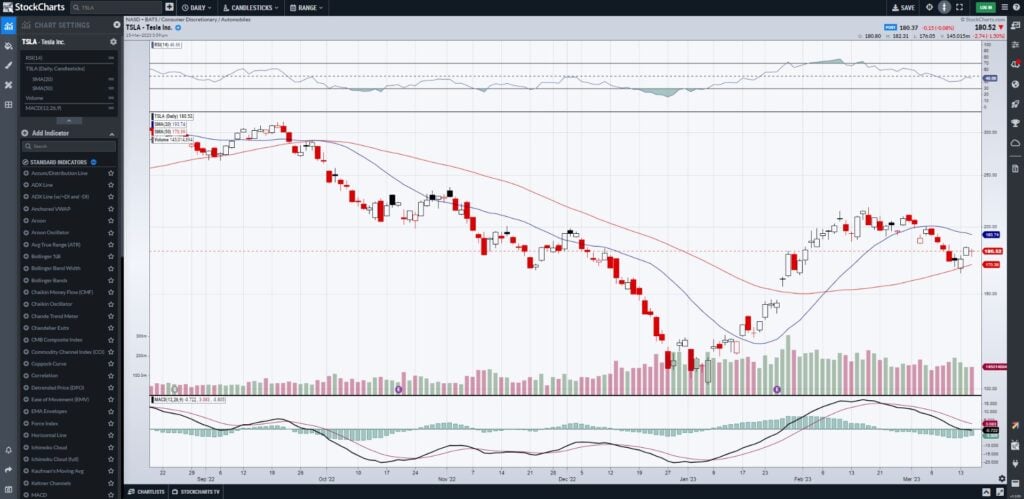
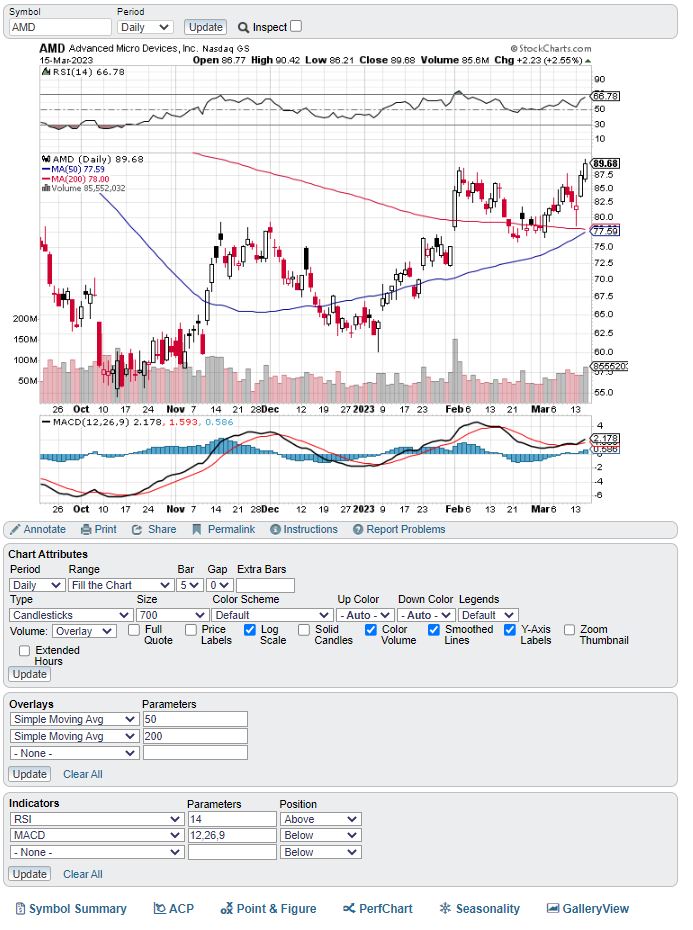
Both platforms deliver comprehensive charting suites and technical analysis tools for professional traders, featuring real-time data, watchlists, price alerts, custom scanners, and extensive additional functionality.
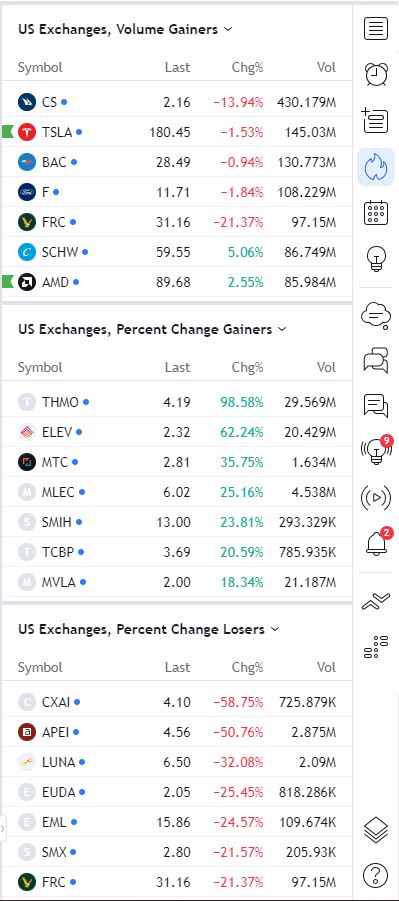
StockCharts Scanner
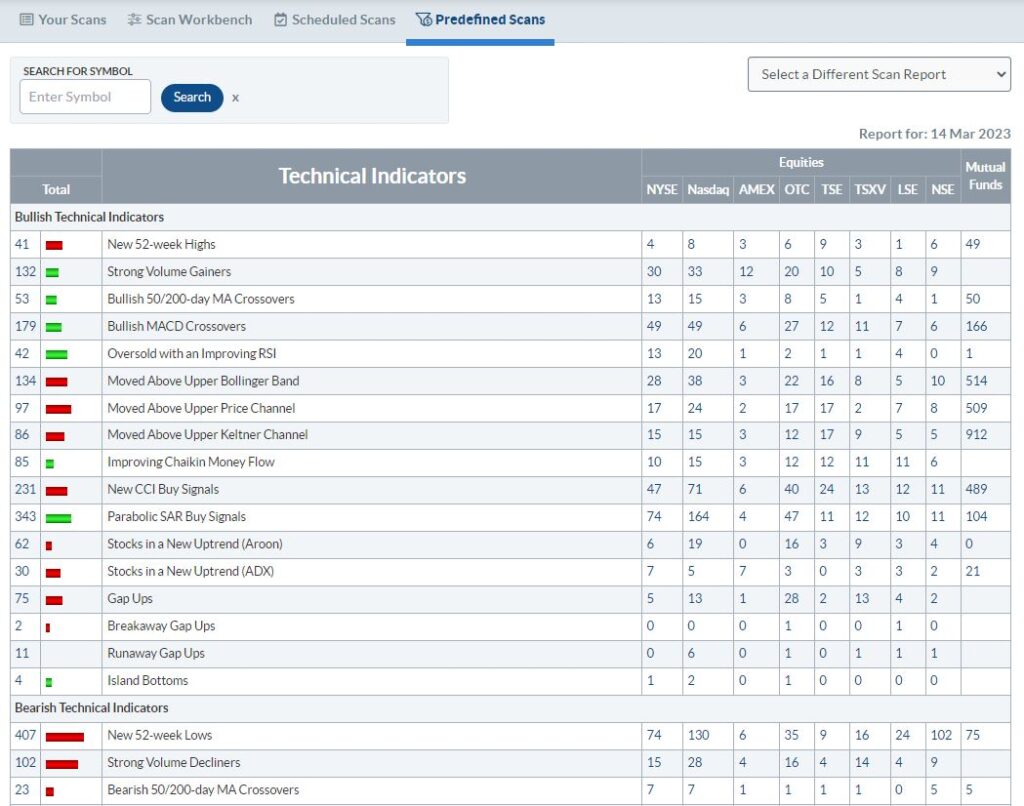
TradingView Scanner

Both platforms include customizable indicators, multi-chart layouts, chart overlays, heat maps, and biggest movers lists, enabling users to tailor their analysis to specific trading strategies.
Each service supports an extensive range of assets—stocks, bonds, futures, forex, and cryptocurrencies—plus broker integrations for direct trading of supported instruments.
Both platforms feature current earnings and economic calendars alongside real-time market news, accessible through convenient sidebar navigation or well-designed mobile applications.
Both services provide comprehensive toolkits that accommodate traders across virtually all experience levels, styles, and strategies, making either platform a viable choice for most users.
Differences:
Despite these similarities, several key distinctions between the platforms may prove significant for certain trading approaches or preferences.
Social Community:
TradingView features an integrated social community where users share trading ideas, custom indicators, and collaborate with fellow traders—a potentially valuable resource for many users.

StockCharts lacks a comparable interactive social community, though it maintains extensive blogs and regular market commentary.
Educational Resources:
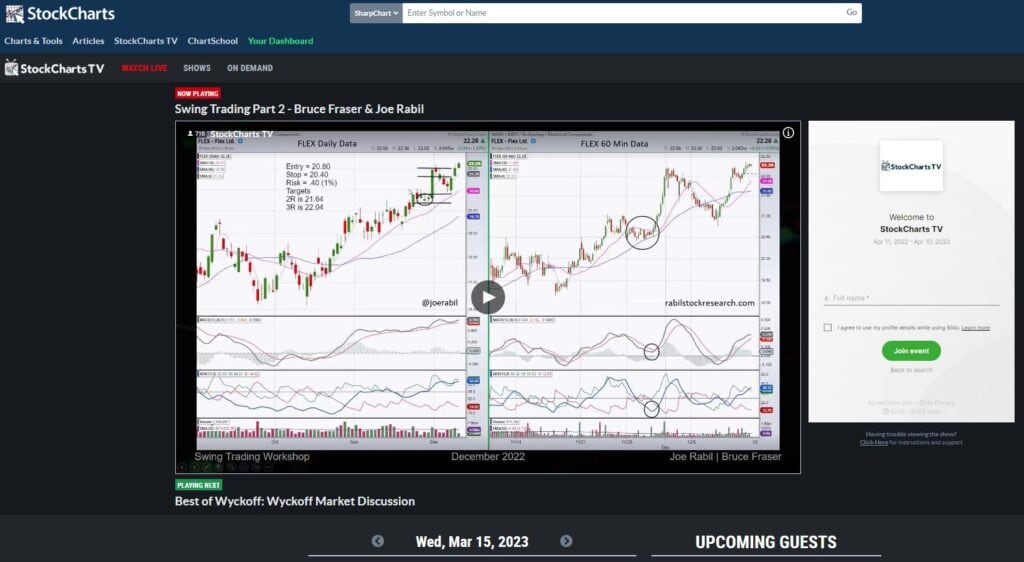
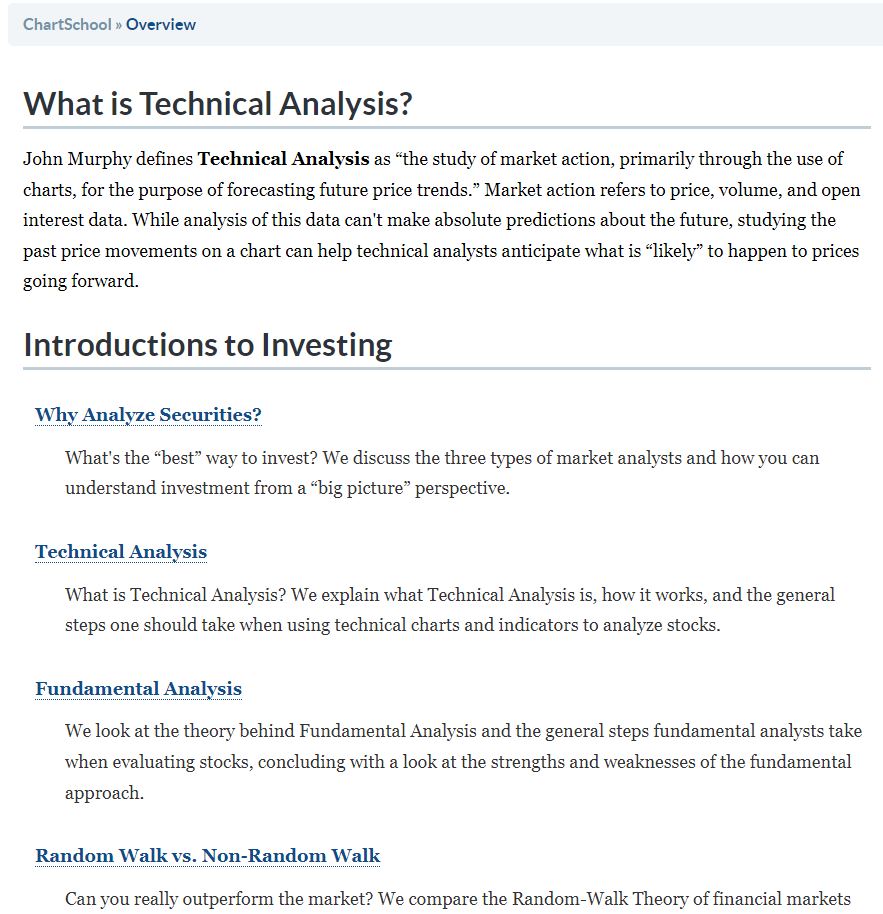
The most significant distinction lies in StockCharts’ extensive focus on financial and trading education.
Through its comprehensive blog network, instructional videos, live webinars, ChartSchool technical analysis curriculum, professional commentary, and StockChartsTV, the platform offers substantial educational value for markets and trading.
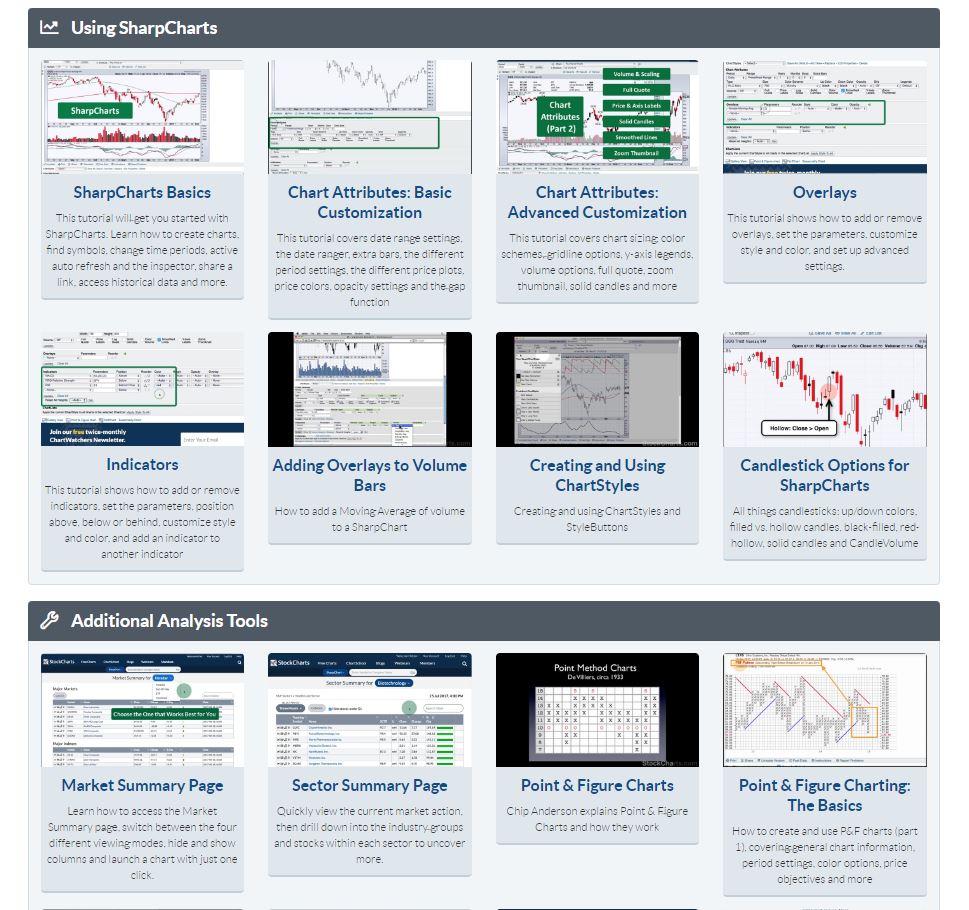
While TradingView’s community provides some educational value, it’s not explicitly designed for learning, making StockCharts the clear choice for knowledge-seeking traders.
Unique Features:
TradingView’s standout qualities center on its polished design and exceptional user experience. The interface proves more intuitive while providing faster, more extensive access to charting tools.
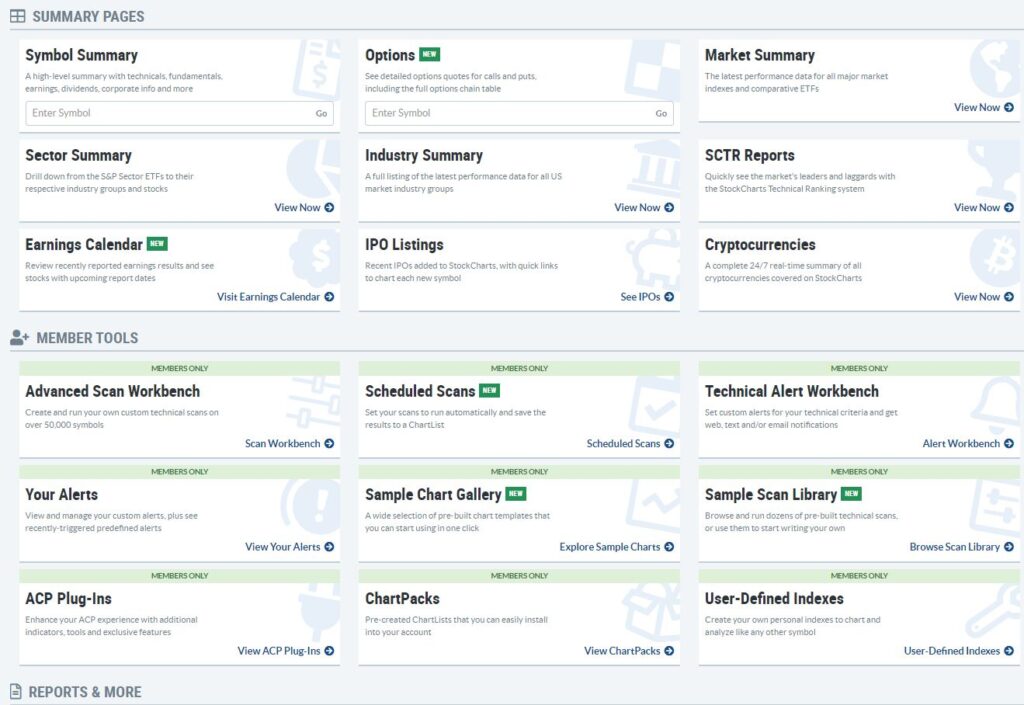
StockCharts distinguishes itself with features unavailable on TradingView, including customized dashboards, option quotes, market summary pages, and seasonality charts.
Given the numerous subtle differences and specialized features, we strongly recommend exploring both platforms to identify which elements most appeal to your trading style.
Price:
Both TradingView and StockCharts provide free access to limited features alongside three tiers of monthly subscription plans.
TradingView’s paid plans are priced at $12.95/mo, $24.95/mo, and $49.95/mo when billed annually.
StockCharts offers similar functionality through plans priced at $14.95, $24.95, and $39.95, with one month free when paid annually.
Since pricing remains quite comparable between platforms, your decision should focus primarily on each platform’s unique features and capabilities.
Which Service is Better?
The superior choice ultimately depends on individual user needs and preferences.
For most traders, both platforms offer remarkably similar functionality, making personal trading requirements the determining factor.
TradingView excels for traders seeking community engagement and collaboration opportunities. Its streamlined access to hot lists and market activity via sidebar tabs particularly benefits faster-paced trading styles.
The platform’s superior aesthetic and user-friendly interface alone may prove decisive for many users.
Conversely, StockCharts better serves traders prioritizing education and skill development, given its extensive learning resources and educational emphasis.
StockCharts also provides distinctive features like customized dashboards, option quotes, market summary pages, and seasonality charts unavailable on TradingView.
Both services deliver exceptional value and will serve traders exceptionally well. Here’s where each platform particularly excels:
TradingView Wins:
- Social Community: TradingView’s social community is a valuable resource for traders looking to connect with other traders and share ideas.
- User-Friendliness: TradingView was clearly designed with an emphasis on the user interface, with a beautiful and customizable look, intuitive tool selection, and an overall seamless experience, including its top-notch market news feeds.
StockCharts Wins:
- Educational Resources: StockCharts places a strong emphasis on financial and charting education, including articles, StockChartsTV to follow live analysis, and a ChartSchool.
- Comprehensive Platform: StockCharts is a more comprehensive platform, with a wider range of tools and features for tracking markets, including option quotes, scheduled stock scanning, and summaries for sectors, industries, IPOs, and more.
FAQs:
Q: Is TradingView or StockCharts better for traders?
A: TradingView offers a superior user interface, larger trading community, and may better suit high-frequency traders, while StockCharts provides more comprehensive tools and learning resources. The optimal platform depends on your specific requirements.
Q: Can you trade directly from TradingView or StockCharts?
A: Yes, TradingView offers integrations with many brokers, allowing you to trade directly from the platform. StockCharts also supports a broker integration, but only through Tradier.
Q: Can I use TradingView or StockCharts on mobile devices?
A: Yes, both TradingView and StockCharts have mobile apps that allow users to access their accounts and trading tools on the go.
Q: Are there free plans for TradingView or StockCharts?
A: Both TradingView and StockCharts offer a limited selection of free features, including price charts, certain technical indicators, and various educational resources in the case of StockCharts.